The goal of this lab was to gain experience on the measurement and interpretation of spectral reflectance of Earth surface materials. Also, to perform basic monitoring of Earth resources using remote sensing band ratio techniques. We monitored the health of vegetation and soils using simple band ratio techniques. By doing this lab we are now able to collect and properly analyze spectral signature curves for various Earth surface features.
Photographs and images used in this lab are:
- Landsat ETM+ image of Eau Claire county and other regions in Wisconsin and Minnesota.
Methods
Part 1: Spectral signature analysis
In part 1 we used Landsat ETM+ of Eau Claire and surround regions. I measured and plotted the spectral reflectance of 12 materials and surfaces from the image of Eau Claire taken in 2000.
1. Standing Water
2. Moving water
3. Vegetation
4. Riparian vegetation.
5. Crops
6. Urban Grass
7. Dry soil (uncultivated)
8. Moist soil (uncultivated)
9. Rock
10. Asphalt highway
11. Airport runway
12. Concrete surface (Parking lot)
In order to collect the spectral signatures I drew a polygon within the feature I'm trying to measure. This is done using the signature editor tool. After taking the 12 signatures. A graph is created to show the difference between all 12. The initial signature is shown below in Figure 1. In Figure 2, is a graph showing all 12 signatures.
 |
| Figure 1: The first initial signature of standing water. |
 |
| Figure 2: All 12 signatures. |
We then needed to specify the spectral channel (band) in micrometers for highest and lowest reflectance for signatures 2 through 12.
Sig 2, Moving water: Highest is band 1,
0.45-0.52. Lowest is band 6, 0.52-0.90.
Sig 3, Vegetation:
Highest is band 4, 0.78-0.90. Lowest is band 3, 0.63-0.69.
Sig 4, Riparian
vegetation: Highest is band 4, 0.78-0.90. Lowest is band 6, 0.52-0.90.
Sig 5, Crops: Highest
is band 4, 0.78-0.90. Lowest is band 3, 0.63-0.69.
Sig 6, Urban Grass:
Highest is band 4, 0.78-0.90. Lowest is
band 3, 0.63-0.69
Sig 7, Dry soil:
Highest is band 5, 1.55-1.75. Lowest is
band 4, 0.78-0.90.
Sig 8, Moist soil:
Highest is band 5, 1.55-1.75. Lowest is
band 2, 0.52-0.61.
Sig 9, Rock:
Highest is band 5, 1.55- 1.75. Lowest is
band 4, 0.78-0.90.
Sig 10, Asphalt
highway: Highest is band 5, 1.55-1.75.
Lowest is band 6, 0.52-0.90.
Sig 11, Airport
runway: Highest is band 5, 1.55-1.75.
Lowest is band 4, 0.78-0.90.
Sig 12, Concrete
surface: Highest is band 3, 0.63-0.69.
Lowest is band 4, 0.78-0.90.
Part 2: Resource monitoring
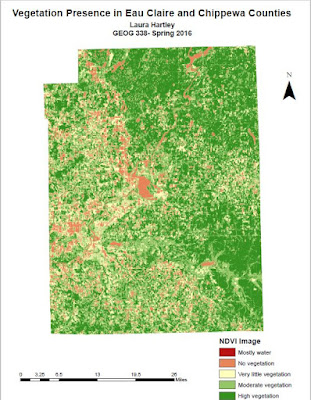
In this section, I performed a simple band ratio by implementing the normalized difference vegetation index (NDVI) on an image of Eau Claire. This was done in order to look at the vegetation of Eau Claire, by using unsupervised- NDVI. Another task was done in order to look at the ferrous minerals of the area. This was done by using unsupervised- indicies. The results of this are shown in the results section in Figure 3 and 4.
Results
 |
| Figure 3: Vegetation in two WI counties. |
 |
| Figure 4: Ferrous minerals in two WI counties. |
These two maps show an inverse relationship between vegetation and ferrous minerals. Overall, this lab was interesting and very informative in how to measure spectral signatures of different features. I think this will be very useful in future remote sensing projects and the final project.
Data Sources
Satellite image is from Earth Resources Observation and Science Center, United States Geological
Survey.
No comments:
Post a Comment